In the dynamic world of financial market trading, Contracts for Differences (CFD) offer traders the opportunity to profit from price movements without owning the underlying assets. CFDs also enable traders to go short as well as long, which means you can speculate on both falling and rising markets. This form of trading requires not only a keen understanding of markets, but also the ability to use various strategies to predict and react to fast-changing market conditions. Among the most powerful of these strategies is technical analysis, a method that uses historical price data and statistical trends to forecast future market behaviour.
One of the key tenets of technical analysis is the study of past, historic price action to determine what the market might do. It’s the “what” as opposed to the “why” of fundamental analysis. The expectation is that history tends to repeat itself so charts which plot patterns in price movements are highly relevant. Indeed, many have been used for over 100 years, with the rhythmic nature of price action credited to market psychology. Price is the key, as it reflects all known information, and the use of technical indicators can help us interpret charts and make informed trading decisions across all markets.
Technical analysis can be particularly valuable in the fast-paced environment of CFD trading where rapid decision-making may be crucial depending on what strategies are used. For experienced traders, technical analysis can be the sole component of their trading arsenal. Advanced technical analysis techniques provide deeper insights into market dynamics, enabling traders to identify patterns, trends, and potential turning points with greater accuracy. These methods include a range of tools and indicators, from simple moving averages to complex pattern recognition and predictive models.
Key Points
- Technical analysis in CFD trading leverages historical price data and statistical trends to forecast market behaviour, helping traders make informed decisions.
- Various chart patterns and technical indicators like Fibonacci retracements and Elliott Wave Theory provide deep insights into market dynamics, predicting potential turning points with high accuracy.
- Combining multiple technical analysis tools enhances trading strategies, though it’s crucial to be aware of their limitations and the importance of broader market context.
Chart Patterns: Identifying Market Sentiments
Chart patterns play a pivotal role in technical analysis, providing key insights into market direction and potential future price action. These patterns are formations that can help traders understand the current mood of the market. They can often highlight where supply and demand is located, which in technical terms is likely where support and resistance are. This may help in forecasting future trends.
There is no single “best” chart pattern. But because they look solely at price and time, these patterns can be applied to any market – forex, stocks, indices, commodities, cryptocurrencies – and across any timeframe.
Common Chart Patterns and Their Interpretations
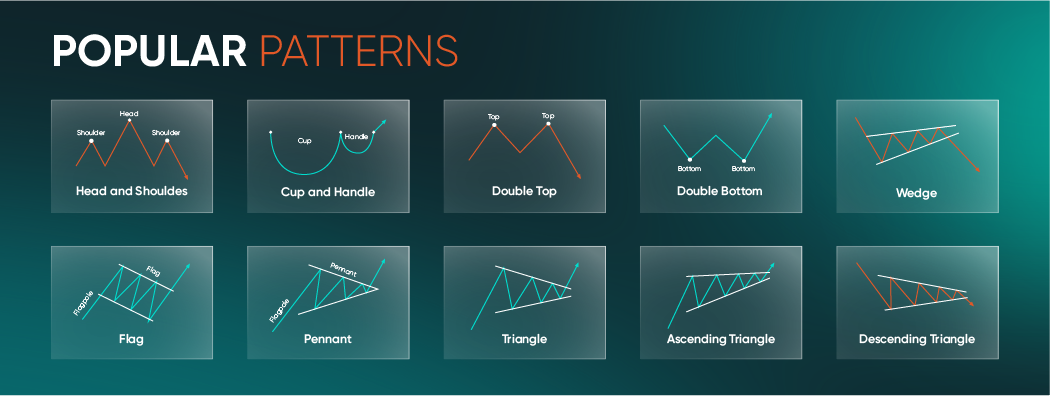
Chart patterns commonly fall into two main types – continuation patterns and reversal patterns. The former signal that a trend has paused and is expected to continue in line with the previous direction. The latter patterns signify that a trend may be reversing and changing direction.
- Head and Shoulders: This can be a reliable pattern indicating a trend reversal. It features a baseline or “neckline” with three peaks; the middle is the highest (head), with the others (shoulders) being lower and roughly equal. This formation suggests a shift from bullish to bearish sentiment if prices fall below the neckline.
- Double Tops and Double Bottoms: These patterns signal resistance (double tops) and support (double bottoms). A double top has two nearly equal peaks, indicating difficulty in breaking through a price level and suggesting a bearish reversal against the prevailing trend. A double bottom has two nearly equal lows, showing strong buying interest and a potential bullish reversal.
- Triangles: These patterns are often seen as continuation patterns. Triangles (symmetrical, ascending, or descending) suggest that the current trend will endure after a breakout, in line with the dominant longer-term trend.
- Wedges:These indicate a trend reversal, with rising wedges typically leading to a bearish outcome when prices break down through support. Falling wedges can be indicative that prices will rise which points to an imminent bullish move.
- Cup and Handle: This bullish continuation pattern looks like a tea cup on a chart, with a rounding bottom as the cup and then a wedge-like pattern as the handle. That indicates a period of consolidation and could be a precursor to a potential upward trend.
Advanced Chart Patterns
- Gartley Pattern: This complex harmonic pattern identifies major market turning points and retracements. It consists of an initial leg, two retracements, and another leg, with key Fibonacci levels at 38.2% and 61.8%. This pattern helps pinpoint the start of a retracement and a trend continuation.
- Elliott Wave Theory: Based on crowd psychology, this theory suggests that prices unfold in specific patterns or waves. There are five waves in the direction of the main trend followed by three corrective waves. This approach helps predict future trends as markets trade in repetitive cycles caused by the predominant psychology of market participants.
Fibonacci Retracements
Fibonacci retracements can be a critical tool in the technical analyst’s toolkit, offering a way to identify potential reversal levels based on key numbers derived from the Fibonacci sequence. This mathematical sequence, in which each number is the sum of the two preceding ones, plays a significant role in many natural phenomena and can be surprisingly relevant in financial markets.
The main Fibonacci ratios – 23.6%, 38.2%, 61.8%, 76.4% – are derived from relationships within the Fibonacci sequence. These ratios are believed to reflect important psychological levels in markets, and are best used when the market is trending. Analysts apply these levels to identify potential areas where the market may reverse or stall, thus providing opportunities for trading entry and exit points.The most important ratio, approximately 61.8%, is often referred to as the “golden ratio” or “phi.” This can be found in many natural objects.
To use Fibonacci retracements, traders plot a series of horizontal lines between a recent major swing high and a swing low point on a chart. These lines indicate where support and resistance are likely to occur and can act as areas of interest in price action. For instance, after a large price move, traders can use these levels to anticipate where a retracement might pause.
Here’s a simple step-by-step guide to setting up Fibonacci levels:
Identify a significant price movement in an asset’s chart.
1. Select the Fibonacci retracement tool in Vantage Markets trading platform.
2. Click on the low of the price move in an uptrend, and drag the cursor to the highest point of the movement (or vice versa for a downtrend).
3. The tool will automatically display the key Fibonacci ratios between these two points.
Combining Fibonacci with Other Indicators
For more robust trading strategies, Fibonacci levels can be combined with other forms of technical analysis, including:
- Moving Averages: Traders might look for prices that bounce off a Fibonacci level and also align with moving averages.
- RSI (Relative Strength Index): A Fibonacci retracement from a significant high or low to a point where the RSI shows overbought or oversold can signal a strong reversal. We look at this indicator in more depth below.
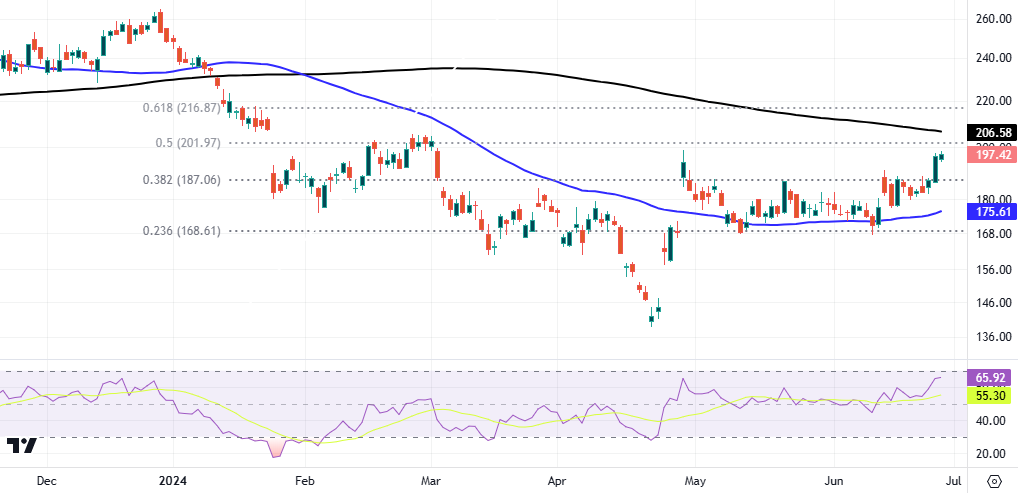
Tesla (TSLA) in 2024
The Tesla chart shows a strong downtrend from the highs in late December 2023 until the swing low in April 2024. The blue and black lines are the 50-day and 200-day simple moving averages. A “death cross’ ‘ appeared when the 50-day crossed below the 200-day. Prices were deeply oversold at that point on the RSI as they dipped well below 20 and partially retraced. The stock eventually fell below $140, was again oversold on the RSI indicator and bounced back, finding resistance at the 38.2% Fibonacci level in late April, May and mid-June around $187. Prices are now approaching next potential resistance around the halfway point of this year’s downtrend just above $200. Bullish momentum has been highlighted by the rising RSI towards 70.
Technical Indicators Beyond the Basics
While basic indicators provide a starting point, advanced technical analysis offers deeper insight into market dynamics. Here, we explore some key oscillators, momentum indicators, volume-based tools, and the importance of combining various analytical methods.
Oscillators and Momentum Indicators
- Relative Strength Index (RSI): The RSI is a momentum oscillator used to identify overbought or oversold conditions in a market. It measures the magnitude of recent price changes over a period of time, oscillating between zero and one hundred. Typically, readings over 70 indicate an overbought market, while readings under 30 suggest oversold conditions. This helps traders anticipate potential reversals where price might change direction. Signals can also be generated by looking for divergences between price and the RSI.
- Moving Average Convergence Divergence (MACD): The MACD is a trend-following momentum indicator that shows the relationship between two moving averages. The MACD is calculated by subtracting the 26-period Exponential Moving Average (EMA) from the 12-period EMA. The result of this subtraction is the MACD line. A nine-day EMA of the MACD called the “signal line,” is then plotted on top of the MACD line, which can function as a trigger for buy and sell signals. Although this might sound complex, this gauge ultimately indicates if bullish or bearish price movement is getting stronger or weaker. Don’t forget that moving averages do tend to lag behind price; they are after all, just an average of historical prices.
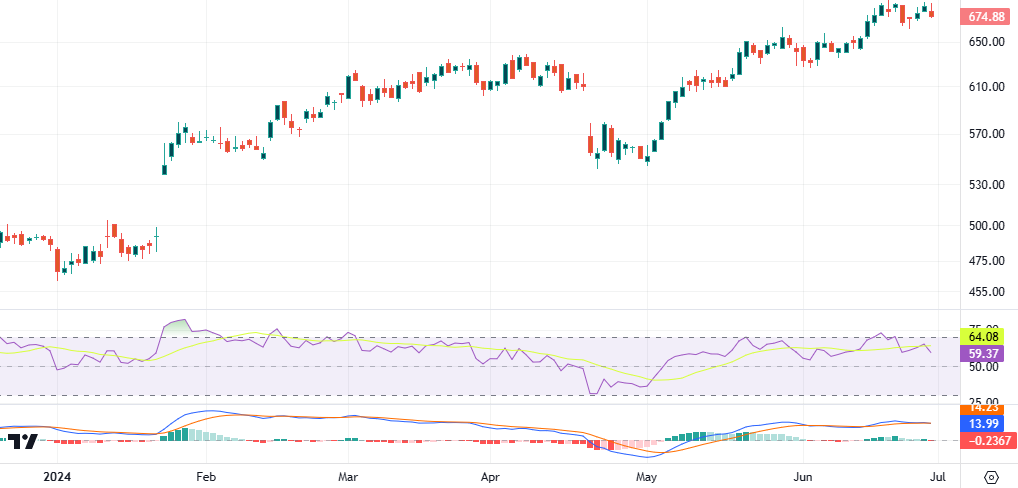
Netflix (NFLX) in 2024
The Netflix 2024 chart shows a gap higher in late January causing overbought conditions on the daily RSI. But this coincided with a “buy” signal from the MACD when it crossed above the MACD signal line. Prices moved higher from around $530 to above $610, before finally gapping lower to find support above $530. At this point, the stock was near oversold levels on the RSI. The MACD gave another buy signal when it crossed above the signal line. Prices have picked up sharply since then, and have hit overbought territory on the RSI. The MACD has crossed below the signal line pointing to a selling opportunity below $690.
Volume-Based Indicators
- On-Balance Volume (OBV): The OBV is a momentum indicator that uses the flow of volume to predict changes in price. The OBV is most popular when trading stocks, as they are most susceptible to price moves based on trading volume. By adding the day’s volume to a cumulative total when the stock’s price closes up, and subtracting the day’s volume when the stock’s price closes down, OBV offers a running total of volume and indicates whether this volume is flowing in or out of the stock. This can help predict bullish or bearish outcomes based on volume trends, which ultimately indicates demand for a stock.
- Volume by Price: This combines price and volume data to help traders identify key price levels where significant trading activity has taken place. The indicator is a histogram on the y-axis of a chart that shows the level of activity at various price points and can highlight areas of supply and demand. This measure is crucial for identifying and helping traders to pinpoint strong support and resistance levels based on accumulated volume. It can enable traders to understand market dynamics better, gaining insight into how price behaves within specific ranges.This might improve the timing of entry and exit points.
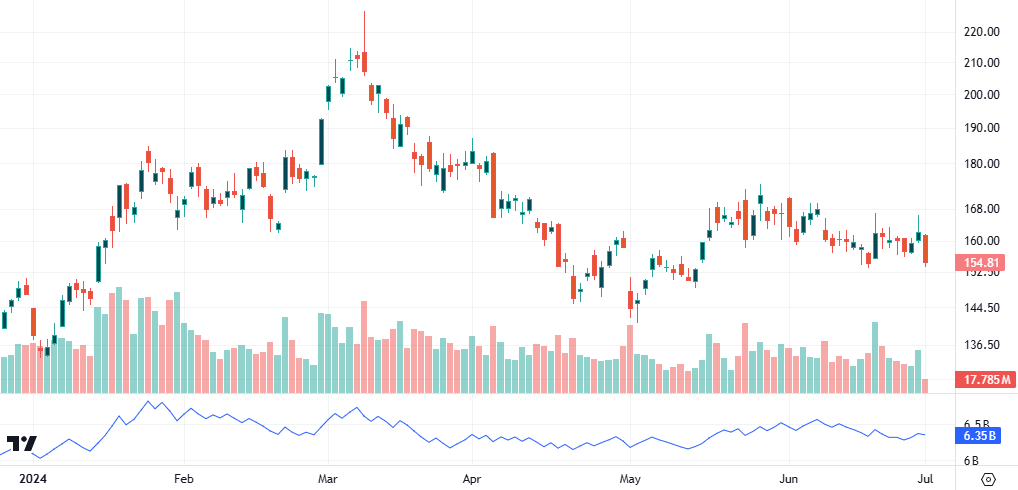
Advanced Micro Devices (AMD) in 2024
AMD printed its current year-to-date lows at the very start of the year at $133.74. But volumes and the OBV picked up quite sharply signifying strong demand for the stock. As the OBV dipped slightly into March, buyers again stepped in heavily, taking prices to a spike high at $227.30. But the OBV didn’t make a fresh year-to-date top marking divergence with price and warning of a sell-off. Prices then fell for several weeks into early May and a low print at $141.16. Interestingly, selling was quite intense here, but the stock moved higher and above $174 in late May.
Integrating Multiple Technical Analysis Tools
Combining Chart Patterns
To develop robust trading strategies, combining a variety of chart patterns and indicators can increase the valuable insights they provide. For example, using Fibonacci retracements with chart patterns like triangles or head and shoulders can indicate precise entry, exit, and stop-loss levels. Additionally, integrating price patterns with RSI or MACD can offer confirmation signals that increase the reliability of a trader’s forecasts..
Strategy Development and Backtesting
Developing a trading strategy involves creating rules based on technical indicators and then backtesting these rules on historical data before applying them in real trading. Backtesting helps verify the effectiveness of the strategy by seeing how it would have performed in the past. This process can highlight the potential for profits and the risks involved, allowing traders to refine their strategies accordingly.
Challenges and Limitations of Advanced Technical Analysis
- Overfitting: This occurs when a strategy is overly tailored to historical data, leading to poor performance.
- Ignoring Market Context: Technical indicators can fail if traders ignore broader market trends or news events that significantly impact prices.
- Mixed signals: The huge variety of advanced tools can mean forming a definitive view is challenging. Two different indicators can throw up contradictory information which may cause confusion.
- Not an exact science: There is no guarantee that previous price patterns and advanced analysis will determine future price action.
Two advanced technical analysts can come to very different conclusions as they are using very different methods of analysis. Much might depend on what timeframe a trader is using, as the trend on a one-hour chart may be very different to that on a weekly timeframe.
Ultimately, while advanced technical indicators and analytical tools offer enhanced insights into market behaviour, they must be used carefully and in conjunction with a broader understanding of market dynamics. By combining various methods and continuously refining strategies through backtesting, traders can improve their ability to predict market movements and make more informed trading decisions.
Conclusion
All these different moving parts of technical analysis are best used in conjunction with each other. For instance, support and resistance zones are frequently used with the MACD to find price levels where trends might reverse. Similarly, candlestick patterns can be used with the MACD to determine areas of technical significance.
There are many different types of oscillators and tools, and combined with volume can be an important tool in your trading armoury. By delving deeper into the indicator and seeing which works best with your trading style, you can build a unique trading strategy that will hopefully enable you to understand and get to grips with price movements across all financial markets. Figuring out repeating price patterns is a lot of fun, after all it is history repeating itself.
Ready to test out these technical analysis techniques? Sign up for a live account and start trading with Vantage today.