Launched in 1896, the Dow Jones Industrial Average (DJIA) is one of the earliest market indices to be established, and remains in widespread use today. It is also one of the simplest, with only 30 constituents.
This is unusual considering how other renowned market indices such as the S&P 500, or the NASDAQ track many more constituents – 500 and 100, respectively. Considering its advanced age and relatively thin coverage, why is the DJIA still actively referenced as a market benchmark, and why does it continue to be actively traded even today?
In this article, we will take a deep dive into the DJIA to understand its makeup, importance to the economy, and the trading potential it offers to investors.
Key Points
- The Dow Jones Industrial Average (DJIA) is a key market index that tracks the top 30 blue-chip companies in the US
- Trading the DJIA with CFDs offers potential benefits, such as leverage and the ability to take both long and short positions.
- The DJIA remains an important economic barometer and is actively traded due to its focus on high-quality, well-established companies.
What is the Dow Jones Industrial Average? [1]
The DJIA (also known as The Dow, or the DJ30) is a significant market index that tracks the top 30 publicly traded blue-chip companies in the US Created by business partners Charles Dow and Edward Jones, the Dow is the second-oldest US market index, with the Dow Jones Transportation Average being the first.
The Dow rose to prominence when it was observed in the 20th century that the performance of industrial companies was tied to the economic growth rate of the US This cemented the DJIA as an important barometer of the American economy, and even today, the strength or weakness of the Dow is regarded as indicative of strength or weakness of the economy.
Perhaps the reason why the Dow has managed to remain functioning so well as a market benchmark by tracking just 30 companies is due to the pedigree of its exclusive constituent list. While coming from different sectors, all 30 companies tracked by the Dow are top-notch companies with a proven history of consistently stable earnings.
Trading Hours of the DJIA [2]
As constituents in the Dow are also represented in the S&P 500 and the NASDAQ, traders can follow the trading hours of the New York Stock Exchange.
- Mondays to Fridays
- 9.30 am to 4 pm
- Pre-opening phase
- Pre-market: 4:00 am to 9:30 am
- After hours: 4:00 pm to 8:00 pm
The exchange is closed on Saturdays and Sundays, as well as nine national holidays, as follows:
- New Year’s Day
- Martin Luther King, Jr. Day
- Presidents’ Day
- Good Friday
- Memorial Day
- Juneteenth National Independence Day
- Independence Day
- Labor Day
- Thanksgiving Day
- Christmas Day
How is the DJIA Calculated? [3]
To keep up with changing trends, the Dow updates its constituent list when necessary, dropping companies that are no longer relevant to the current economy in favour of more suitable entities.
The DJIA employs a calculation method that is unlike those used by other popular market indices.
The Dow is weighted by price, and stocks with higher share prices are given a large weight in the index. During its inception, when the index had only 12 constituents, Charles Dow calculated the average by adding the prices of the 12 Dow component stocks and dividing by 12, meaning the Dow was a simple average.
However, events such as mergers and stock splits caused outsized fluctuations in the value of the index, and the simple average could no longer sufficiently account for these additions and subtractions.
To solve this issue, the Dow Divisor was introduced, a predetermined constant that would determine the effect of a one-point move in any of the constituent stocks. In other words, a one-point move in any of the constituents will move the index by an identical number of points.
Thus, this evolved the DJIA from a simple average index to one that reflects the sum of the price of one share of stock for all the components, divided by the divisor.
Throughout its history, the Dow had made adjustments to the divisor to keep the value of the index consistent. As at February 2024, the DJIA divisor is 0.15265312230608.
What Companies are in the Dow Jones? [4]
The Dow draws constituents from all sectors except transportation and utilities. These two sectors are covered in the Dow Jones Transportation Average and the Dow Jones Utilities Average instead.
Currently, the DJIA includes companies from nine different sectors. Here is the sector breakdown of the index at the time of writing [5].
| Sector | Index weight (%) |
| Financials | 23.2 |
| Information Technology | 18.6 |
| Healthcare | 17.9 |
| Consumer Discretionary | 15.2 |
| Industrials | 13.8 |
| Consumer Staples | 4.9 |
| Energy | 2.8 |
| Communication Services | 2.6 |
| Materials | 1.0 |
Top 10 Constituents of the DJIA [6]
The top 10 constituents of the index at the time of writing are as follows:
| Company | Weight |
| Unitedhealth Group Inc | 8.521124 |
| Goldman Sachs Group Inc | 7.552353 |
| Microsoft Corp | 6.888966 |
| Caterpillar Inc | 5.939177 |
| Home Depot Inc | 5.677419 |
| Amgen Inc | 5.136086 |
| Visa Inc Class A Shares | 4.6522 |
| Salesforce Inc | 4.621062 |
| Mcdonalds Corp | 4.517824 |
| American Express Co | 3.973827 |
Benefits of Trading the Dow Jones
The Dow Jones Industrial Average is suitable for investors who want to focus on the top blue-chip publicly traded companies in the U.S, due to its narrower focus on just 30 companies.
It is undoubtedly easier to keep up with news and earnings of 30 companies compared to the hundreds in the NASDAQ or the S&P 500. Even though it tracks fewer companies, it’s important to remember that the DJIA essentially measures the cream of the crop of the global stock market.
While there are certainly periods where the Dow underperforms, such as during tech rallies when it is outshined by the NASDAQ, the index is more than capable holding its own over the long run.
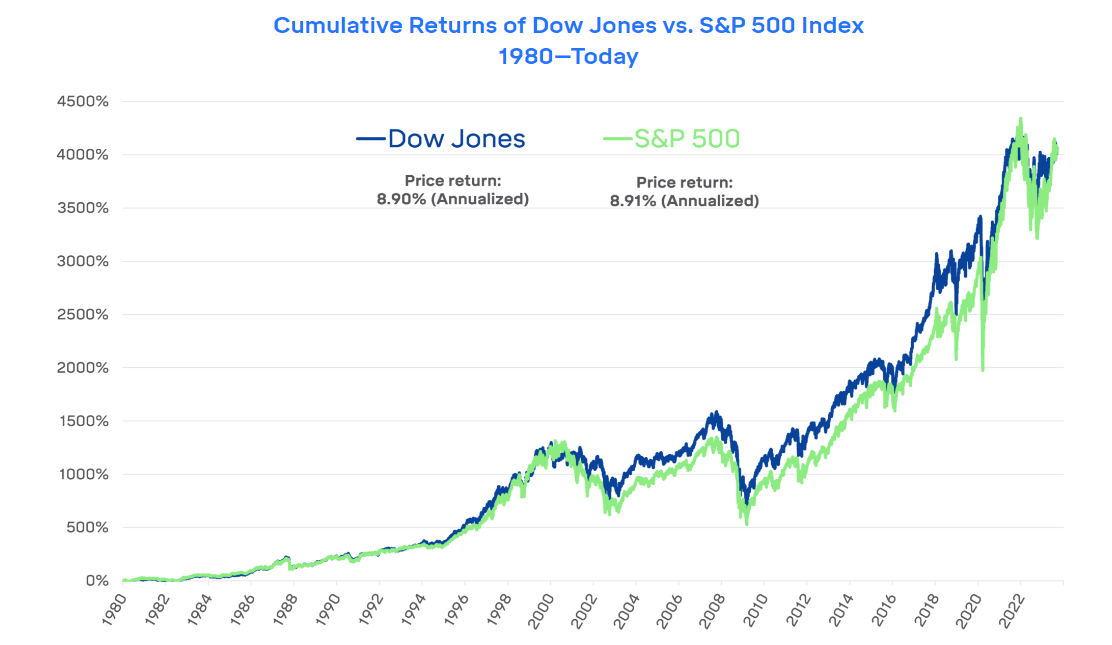
In this screenshot, we see that the Dow and the S&P have starkly similar performance, with annualised returns of 8.9%, vs 8.91% [7].
Perhaps this shows that focusing on quality rather than quantity can pay off just as well.
Historical Trends of Dow Jones [8,9]
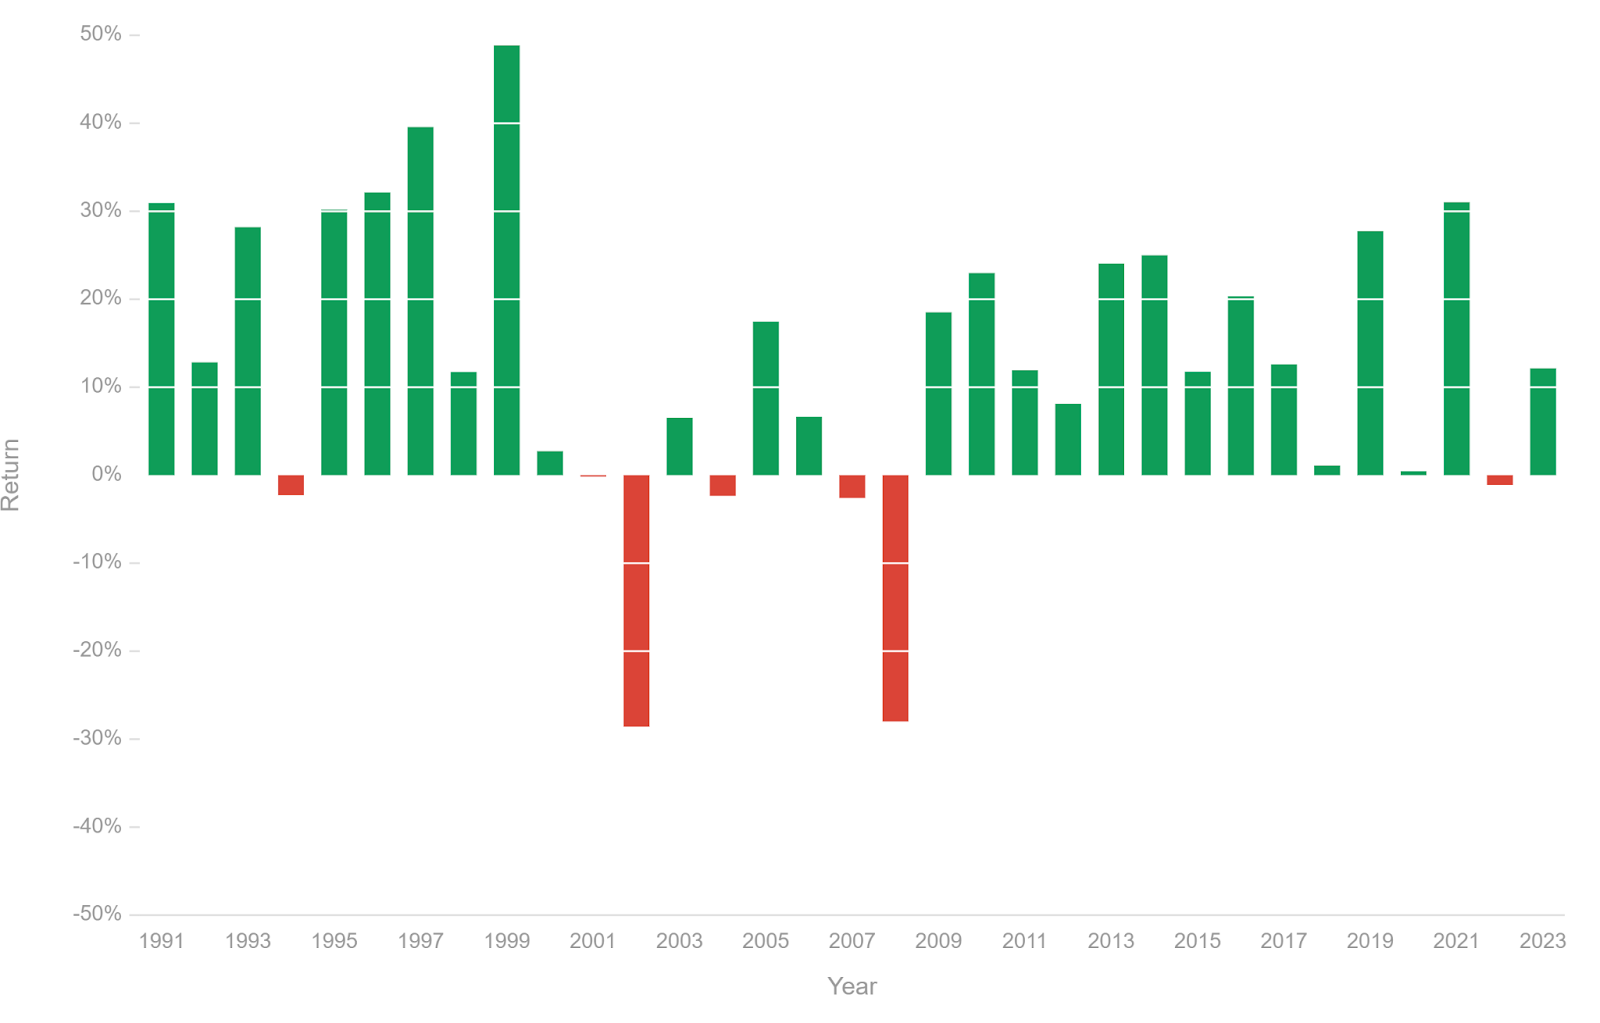
The historical returns chart of the Dow reflects the general arc of the U.S. economy at large. Good economic performance during the 1990s saw the Dow enjoying some of its best years, generating record-breaking returns in 1995 (36.94%), 2003 (28.28%) and 2013 (29.65%).
During the dot-com bubble of the 2000s, the Dow was not spared even though it is relatively less concentrated in tech than the NASDAQ or the S&P 500. However, this demonstrates the far-reaching consequences of the U.S Federal Reserve’s decisions when it progressively raised interest rates from 1999 to 2002 in an attempt to cool down the stock market.
As a result, the Dow lost 15% in 2002, a severe drop that would only be seen again in 2008, when the subprime mortgage crisis saw the index end the year down by 31.9%.
Since then, the Dow has charted a consistent upward trajectory, with positive gains every year up to 20%++, save for a 1.10% drop in 2022.
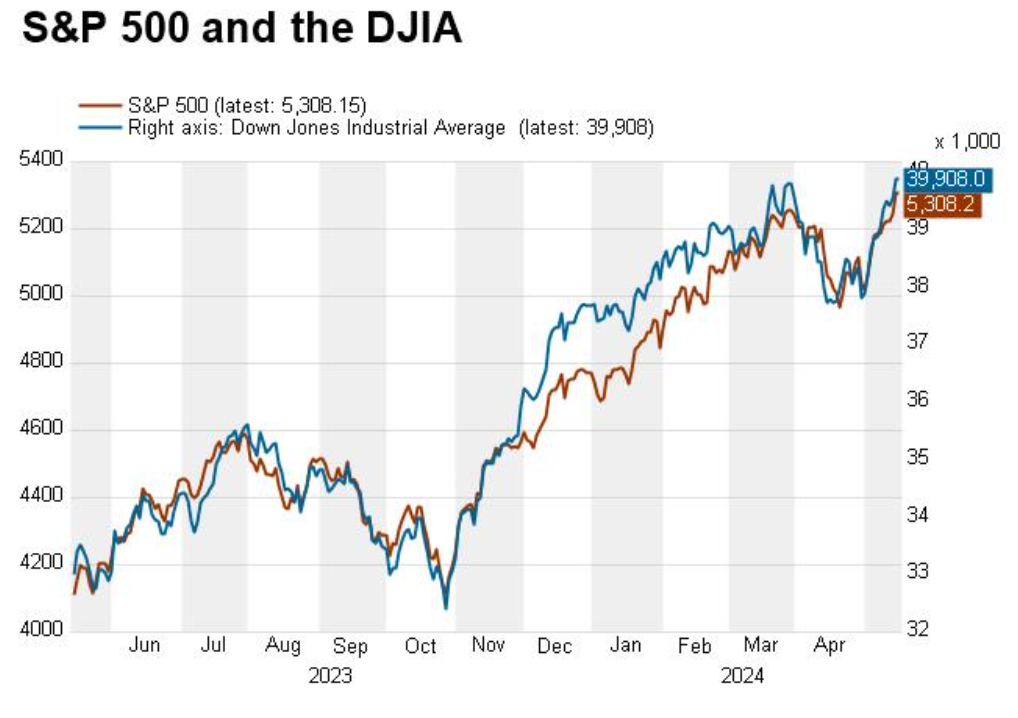
Today, the Dow continues to offer high trading potential for investors. The index is comfortably keeping up with the S&P 500, as shown in the screenshot below.
How to Trade the Dow Jones
The DJIA, being an index, cannot be directly traded or invested in. That’s because it is simply a benchmark of publicly listed blue-chip US companies and does not hold any stocks of those companies.
Hence, investors would need to use derivatives such as Contracts-for-Difference (CFDs) or index Exchange-Traded Funds (ETFs) to trade or invest in the index.
Trade the Dow Jones Industrial Average Index with CFDs
CFDs are financial derivatives that allow speculation in an underlying instrument, in this case, the DJIA. There is no direct ownership involved, only the price action is traded.
Trading the DJIA using CFDs offers several benefits. For one, you can trade with leverage, which will amplify your gains if the index moves as you expected. However, if the index moves against you, leverage will amplify your losses, so it’s important to observe caution when leverage is involved.
Secondly, CFDs allow you to take both long and short positions, so you can potentially benefit from the DJIA’s price action in both up and down directions.
Thirdly, CFDs offer a lower barrier to entry, as you can start trading with relatively smaller capital.
So how does trading the DJIA with CFDs work? Here’s a simplified explanation.
You open a trade by choosing whether the index will go up or down. If the price goes with your position, you make a profit. If it goes against your position, you will incur a loss.
At the close of the contract, the difference in the price of the index is settled directly in your account. There is no need to take ownership of stocks that are represented in the DJIA.
Trade Dow Jones Industrial Average Index ETFs with CFDs
Earlier, we mentioned that you can use an index ETF to invest in the DJIA. Such ETFs attempt to replicate the performance of the Dow by investing in the same stocks in the same proportion.
Investors can buy shares of a DJIA index ETF and reap capital gains when the Dow rises in value. When the index falls, the value of your index ETF shares falls as well. Due to the short-term volatility inherent to the stock market, index ETFs are best deployed as part of a long-term strategy.
To bypass these drawbacks, traders can also invest in DJIA ETFs using CFDs. This works the same way as the method mentioned above, and offers the same three benefits of leverage, profit potential in both directions, and lower capital to start trading.
Analysing the Dow Jones Market
Fundamental Analysis
As the DJIA is one of the three most important U.S. market benchmarks, fundamental analysis would naturally revolve around studying the American economy and its interactions with other major trade partners.
Economic data, corporate earnings, interest rates and other major macroeconomic indicators and factors all have a role in influencing which way the Dow goes. We’ll discuss these fundamental factors in greater detail later on in the article.
Technical Analysis
Technical analysis is another way to understand the behaviour of the DJIA. With a price chart and basic charting tools, it is possible to study and interpret the Dow using technical indicators for a more informed trading decision.
You can consult our other guides for detailed explanations on technical indicators and technical analysis. It’s crucial to understand that technical indicators are merely tools that help us form an informed opinion on the state of the market. No indicator is 100% accurate, nor is there any that can predict which way the index will go.
Line of Support & Line of Resistance
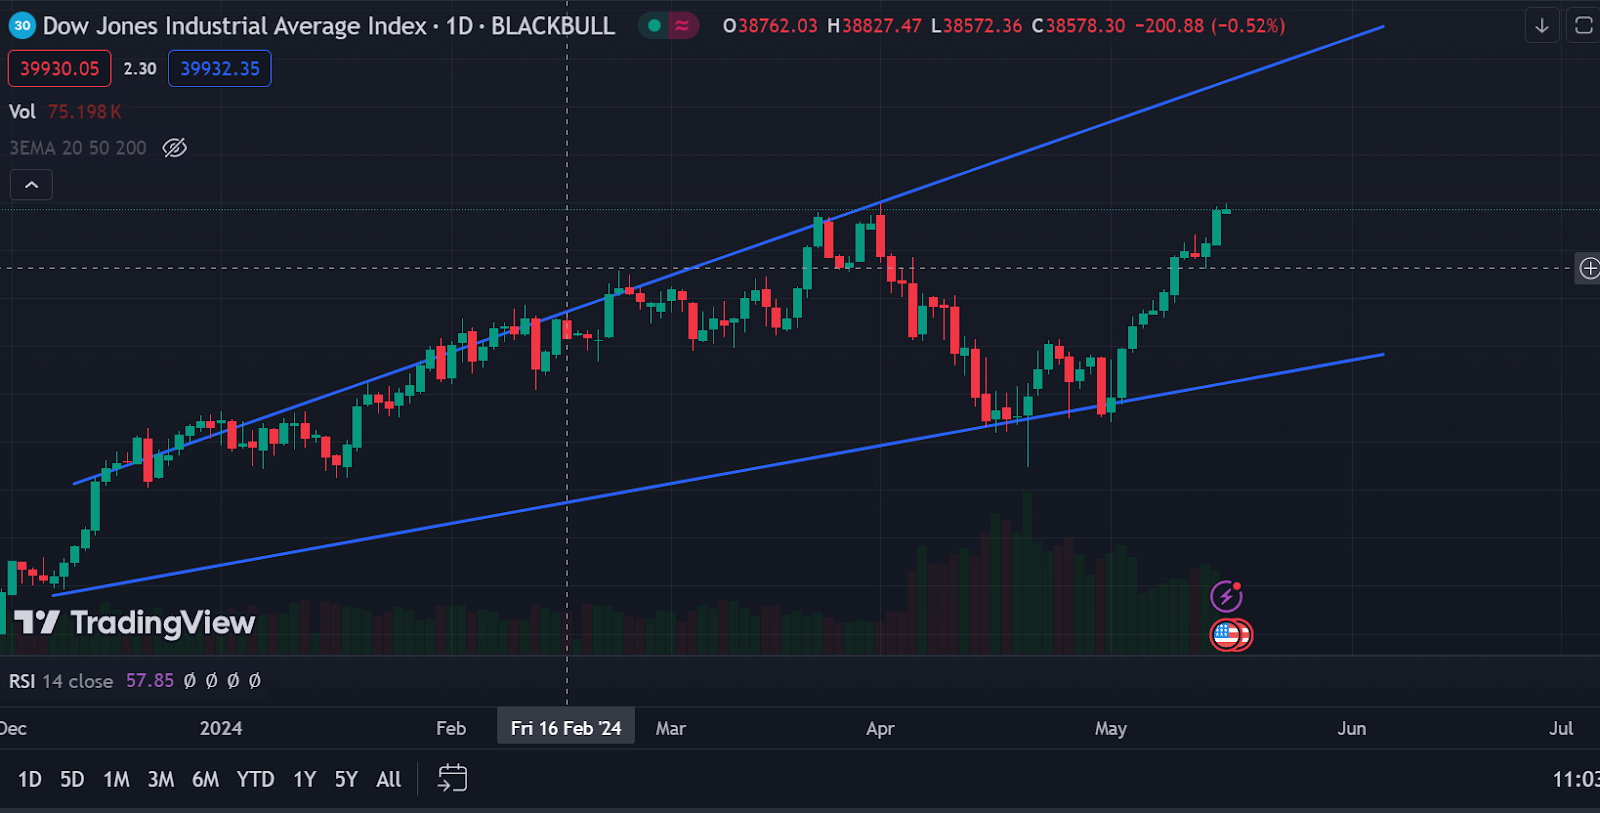
The screenshot above shows the price chart of the DJIA in the most recent six months. Both blue lines are what are known as trend lines, and together they can tell us a few insights.
The line at the top is known as the Line of Resistance. It is plotted by joining as many of the most recent price tops (highest points reached by the candlesticks) as possible. The empty area to the right under the line represents the possible upper limit of the price of the index over the next few weeks.
The line at the bottom is the Line of Support, drawn by joining as many of the recent price bottoms (lowest points reached by the candlesticks) as possible. Again, the empty area to the right above the line shows the possible lower limit of the index’s price over the next few weeks.
In other words, drawing the lines of support and resistance this way shows us where the index is likely to fall over the next few weeks. The further back you go, the more accurate the range will be. But for the purposes of this explanation, we’ve zoomed in for greater clarity.
When used in this way, Lines of Resistance/Support can give you an idea of what would be a reasonable price range to expect – provided there is no shock to the system such as unexpectedly low inflation numbers, or surprise announcement of interest rate hikes.
Candlestick Pattern: Three White Soldiers [10]
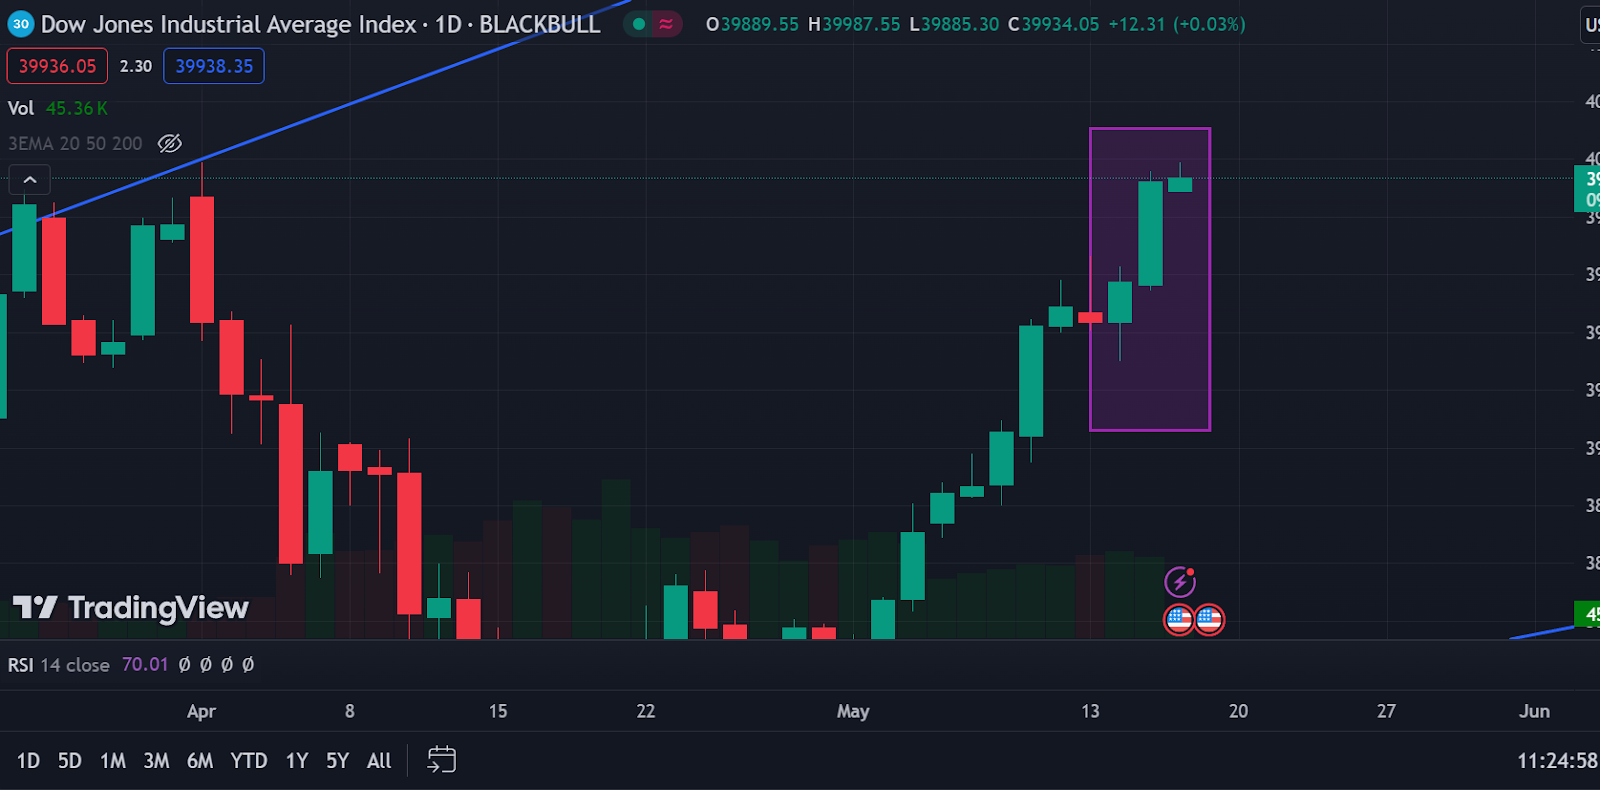
Here’s the same screenshot again, but we’ve zoomed in on the most recent trading periods.
In the purple square, we see three green continuous candles. This is a candlestick chart pattern known as “Three White Soldiers”, which points to a bullish trend. When this pattern forms during a downtrend, it signals a trend reversal to the upside is coming.
In our chart here, we see the pattern forming after a short, red candle. It is also part of a strong uptrend. This tells us the DJIA is likely to continue moving upwards over the short term, unless, again, the market is disrupted in some way.
Understanding Dow Jones Market Factors
The Dow is affected by several market factors which can broadly be split into the following areas.
Economic Factors
The DJIA is sensitive to economic factors such as GDP, interest rates and inflation levels, and investors should not neglect such data. Often the price action of the Dow can be explained by news or developments surrounding GDP results or interest rate changes.
GDP figures are an important indicator of economic growth, which impacts the Dow directly. Poor GDP numbers will likely be reflected in the Dow’s falling, while a steady rise in the DJIA is often taken as a herald of good GDP results.
Inflation is another essential economic factor, as high inflation can reduce corporate profits, driving the DJIA down. For example, the Dow broke its 13-year winning streak in 2022, due to the effects of prolonged high inflation and the resulting interest rate hikes.
Exchange rates are closely related to inflation, and can also impact the DJIA. When the US Dollar becomes too strong, U.S. exports will become more expensive, causing downward pressure on export-related stocks in the index.
Company Performance
The performance of the constituents in the DJIA can offer clues on where the index is headed next, especially since the index is weighted by share price. A greater number of constituents with favourable earnings is likely to lift the index, and vice versa.
Company news and events can also have effects, positive or negative, especially if they involve large-cap public companies.
Global Events
Given how globally interconnected the modern economic system is, the DJIA is not immune to the impact of global events. Geopolitical instability such as wars and trade tariffs can interfere with natural market pricing, curtailing corporate profits and lowering market confidence.
Natural disasters can also impact the Dow. During Hurricane Katrina in 2005, crude oil prices spiked and stocks continued to fall, resulting in the Dow closing by 0.48% in a day [11].
Commodity Prices
As industrials, consumer staples and energy make up three of the nine sectors in the DJIA, the index can exhibit sensitivity to commodity prices such as crude oil, metals or agricultural produce.
In particular, price shocks in the commodities sector can cause increased volatility in the Dow.
Investor Sentiment
It may be worth taking market sentiment into account when trading the Dow. If there is strong optimism or pessimism among investors, this can sometimes sway the markets in unexpected ways, at least in the short term.
Although prices often correct themselves market mania abates, investor sentiment holds potential to cause or increase volatility in the Dow.
Trading Strategies for the Dow Jones
The Dow’s dynamic and diversified composition makes it a versatile candidate for a variety of trading strategies, whether short, medium or long term.
Short-term Trading Strategies
Day Trading
Day trading is a short-term trading strategy that aims to make as many winning trades as possible over a short period of time. Instead of a few large wins, day traders focus on making multiple small ones.
Day traders do not hold overnight positions, preferring to close them before the end of the trading day. This is to avoid overnight risk, where unexpected news or events flips the market on your trade.
News Trading
Using a news trading strategy for the Dow is relatively easy, due to the smaller number of companies that are included in the index. This strategy offers traders a more relaxed approach to trading, although investors should maintain readiness to quickly act on breaking news or events.
As news trading involves keeping track of relevant news reports and information such as corporate earnings, economic reports, consumer trends, and etc, an economic calendar can prove helpful.
Mid-term Trading Strategies
Swing Trading
Swing trading aims to capture potential returns when the price of the Dow swings from one direction to the other.
A swing is identified as an instance when the price changes direction from up to down, or down to up. This can occur over several hours or a few days, or longer swings that last several weeks or months.
Success in swing trading requires the ability to accurately identify upcoming swings and then placing appropriate trades to capitalise on them. Longer swings can offer higher potential returns, but also comes with increased risk of not closing your trade in time. It’s essential to set reasonable profit targets and not give in to greed.
Long-term Trading Strategies
As a national index that tracks top blue-chip listed companies, trading the Dow is akin to trading the best of the U.S. economy.
In the last 20 years, the Dow ended 15years in the green, and only 5 in the red [12].
Given this track record, there’s a good chance that long-term trading strategies can pay off handsomely for the patient investor.
However, as the Dow is an index it cannot be owned or traded directly. Hence, investors wishing to mimic the performance of the DJIA over the long term would need to invest in DJIA ETF instead.
At present, there are not many DJIA-tracking ETFs to choose from. Some available ones include:
- SPDR Dow Jones Industrial Average ETF Tr (DIA) – this is the only ETF that replicates the DJIA 100%
- First Trust Dow 30 Equal Weight ETF (EDOW) – this ETF weighs the Dow’s constituents equally instead of by price
- Invesco Dow Jones Industrial Average Dividend ETF (DJD) – includes only dividend-yielding DJIA constituents
As with any investment fund, don’t neglect to check the expense ratio, which is a fee charged by the fund managers for managing the fund. Index ETFs have some of the lowest expense ratios, but these can eat into your returns over the long run.
Risk Management Strategies when Trading the Dow Jones [13]
While the Dow Jones is a highly liquid and well-traded market index, proper risk management should still be implemented. Here are some tips to bear in mind.
Set Proper Trade Sizes
Limit the size of each trade to 2% or less of your total capital. There’s always the chance a losing streak could happen, and applying proper trade sizing will prevent your account from being abruptly wiped out.
Make Use of Stop-loss and Take-profit
One common mistake is overtrading – a situation when you are holding your trade longer than you should, whether to try to recover your losses, or to gain more profit.
The key to preventing this mistake is to set proper stop-loss and take-profit points. This ensures you close your trade in a timely manner, allowing you to move on to subsequent trades.
One suitable point to set a stop-loss is when the index falls below a key support level. As for choosing a take-profit point, watch out for when the index approaches a key resistance level after a large move upwards. This may be a good time to sell and take profit, before consolidation takes place.
Use Leverage with Caution
It bears repeating that leverage will amplify both your profits and your losses. Always remember that reckless use of leverage is highly risky and can inflict losses that exceed your capital, putting your account in the negative.
Have a Trading Plan in Place
Investors must understand that trading requires a highly disciplined approach, and rewards logic and patience, instead of greed and emotion. Going without clear guidelines is likely to lead to failure.
Support your trading journey with a detailed trading plan that spells out your goals and objectives, strategies you will use, maximum risk per trade, and your budget limit for trading each week or month.
Over time, reflect on your trading experiences to build on your trading plan and help you hone the discipline and habits required for long term success.
Conclusion: Trade the Dow with Vantage via CFDs
Trade the Dow Jones Industrial Average with Vantage CFDs to potentially benefit from the cream of the crop of the U.S. stock market without direct ownership of underlying fund units or company shares. Benefit from tight spreads and low cost – starting from $0 per trade.
Explore opportunities to generate potential returns across diverse market conditions, with the choice to open long or short positions, and control risk with tools such as negative balance protection, price alerts and stop losses. With real time new alerts on our mobile app and trading platform, you get the power and flexibility to react quickly to market developments, and trade on the go.
Sign up for a live account and experience the Vantage advantage today.
References
- “What Is the Dow Jones Industrial Average (DJIA)? – Investopedia”. https://www.investopedia.com/terms/d/djia.asp. Accessed 17 May 2024.
- “Holidays & Trading Hours – NYSE”. https://www.nyse.com/markets/hours-calendars. Accessed 17 May 2024.
- “What the Dow Means and How It Is Calculated – Investopedia”. https://www.investopedia.com/articles/investing/082714/what-dow-means-and-why-we-calculate-it-way-we-do.asp. Accessed 17 May 2024.
- “What Does the Dow Jones Industrial Average Measure? – Investopedia”. https://www.investopedia.com/ask/answers/050115/what-does-dow-jones-industrial-average-measure.asp. Accessed 17 May 2024.
- “Dow Jones Industrial Average® – S&P Dow Jones Indices”. https://www.spglobal.com/spdji/en/indices/equity/dow-jones-industrial-average/#data. Accessed 17 May 2024.
- “Dow Jones Companies – Slick Charts”. https://www.slickcharts.com/dowjones. Accessed 17 May 2024.
- “Head-to-Head: Dow vs. S&P 500 (And The Shocking Results) – St Louis Trust & Family Office”. https://www.stlouistrust.com/insights/head-to-head-dow-vs-sp-500-and-the-shocking-results/. Accessed 17 May 2024.
- “Historical Performance Of The Dow Jones Industrial Average Index – Curvo”. https://curvo.eu/backtest/en/market-index/dow-jones-industrial-average?currency=usd. Accessed 17 May 2024.
- “5 ETFs to Own the Dow as It Hits New Highs – etf.com”. https://www.etf.com/sections/news/5-etfs-own-dow-it-hits-new-highs. Accessed 17 May 2024.
- “Using Bullish Candlestick Patterns to Buy Stocks – Investopedia”. https://www.investopedia.com/articles/active-trading/062315/using-bullish-candlestick-patterns-buy-stocks.asp. Accessed 17 May 2024.
- “Markets Assess Hurricane Damage, and Shares Fall – The New York Times”. https://www.nytimes.com/2005/08/31/business/markets-assess-hurricane-damage-and-shares-fall.html. Accessed 17 May 2024.
- “Dow Jones Returns – Slickcharts”. https://www.slickcharts.com/dowjones/returns. Accessed 17 May 2024.
- “Risk Management Techniques for Active Traders – Investopedia”. https://www.investopedia.com/articles/trading/09/risk-management.asp. Accessed 17 May 2024.