Stocks mixed, quiet trade in USD with eyes on US CPI

Headlines
* Fed officials eye “broadening” disinflation as new rate cut test
* Bitcoin surges to $50k for the first time since 2021 on ETF demand
* USD gains modestly, yields and gold drop ahead of US CPI
* S&P 500 and Dow hit fresh record highs, Nvidia overtake Amazon market cap
FX: USD tracked sideways for a fourth straight day. The 100-day SMA sits at 104.26 with recent highs just above at 104.58/60. The 50% retrace level of the Q4 sell-off is initial support at 103.86. All eyes are on the US CPI data out later today.
EUR printed a doji in a narrow range day. Prices remain below an initial zone of resistance at 1.0791/93. We’ve heard from both ECB doves and hawks in the last few days. The former official said the time for easing rates was fast approaching. The more hawkish Holzmann took a more cautious approach to the rate outlook.
GBP is also printed a narrow ranged doji. A plethora of UK data gets released this week including key wage figures and services inflation.
USD/JPY followed the other majors with a small trading range. Treasury yields edged lower helping the yen. Japan GDP comes out later in the week.
AUD found a small bid with NZD giving up some of last week’s gains. Australia employment gets released on Thursday.
Stocks: US equities were mixed in choppy trade post-Superbowl. The benchmark S&P 500 slid 0.01% to settle at 5,002. The tech-dominated Nasdaq 100 lost 0.44% lower at 17883. The Dow Jones outperformed, up 0.32% to settle at 38,797. Stocks initially rallied as Bitcoin surged towards $50,000. It later breached this key psychological level for the first time since late 2021. New York Community Bancorp (NYCB) shares extended Friday’s recovery but faded late on. Goldman Sachs warned about extended positioning in the tech sector.
Asian futures are in the green. APAC stocks were muted amid quiet weekend newsflow. There were numerous stock market closures in the region including in China, Hong Kong, Taiwan, South Korea, Singapore and Japan. The ASX 200 declined amid underperformance in healthcare and commodity-related sectors.
Gold dipped before paring losses in quiet trade. US Treasury yields were unable to extend significantly last week. The 10-year yield is currently capped below the 4.20% area.
Day Ahead – US CPI open to downside risks
The consensus view looks for headline US CPI to rise +0.2% m/m and 2.9% y/y in January (prev. +0.2% and 3.4%), and the core CPI measure is seen rising +0.3% m/m and 5% y/y, matching the monthly rate seen in December and one-tenth lower y/y. CPI has been posting more rapid m/m increases than the Fed’s favoured inflation gauge, the core PCE deflator. This is largely due to the heaving weighting of housing and vehicles in the basket of goods and services used to calculate the consumer inflation rate. Rents are slowing, but those movements take a long time to show up in official data due to the way the series is constructed. Vehicle prices could be a depressing factor on January inflation.
The data will be framed in the context of the Fed’s policy function. Lower inflation readings could be a sign that the central bank could begin cutting rates. Any pickup in price pressures would see a wager on the ‘higher for longer’ playbook. This could see another upside breakout in the DXY.
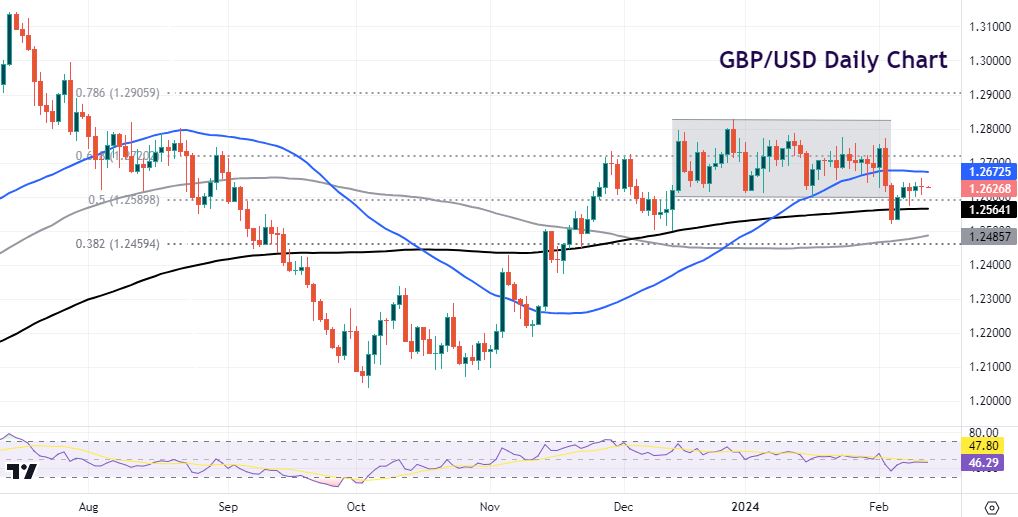
Chart of the Day – Volatile week for GBP/USD
It could be a bumpy ride for the pound this week with all the data set to be released. First up is the jobs figures including the all-important wage growth numbers. This is a key metric for the MPC and is seen slowing further. Both the headline and the ex-bonus measures still remain close to 6% which is too high for policymakers. Any upside surprise would push rate cuts bets further out. The first 25bp rate reduction is seen in August and around 77bps in total for 2024.
Short-term charts in cable lean bearish but the pound’s solid move off last week’s low and relatively firm close suggest some resilience on the weekly chart. Support is the base around the prior range at 1.26 and midpoint of the summer sell-off, with the 200-day SMA below at 1.2564. Resistance above sits at 1.2672.

